Results
Per-Database Z-Scores — Land-Constrained Monte Carlo
Z-score at 50 km threshold under land-constrained Monte Carlo simulation (N=10,000 trials). All databases corrected for coastal bias.
Land-constrained baselines reject ocean placements via Natural Earth 1:10M land mask. See methodology § 5b for the correction protocol.
Higgs boson discovery threshold: Z = 5. Medical trial threshold: Z ≥ 2.
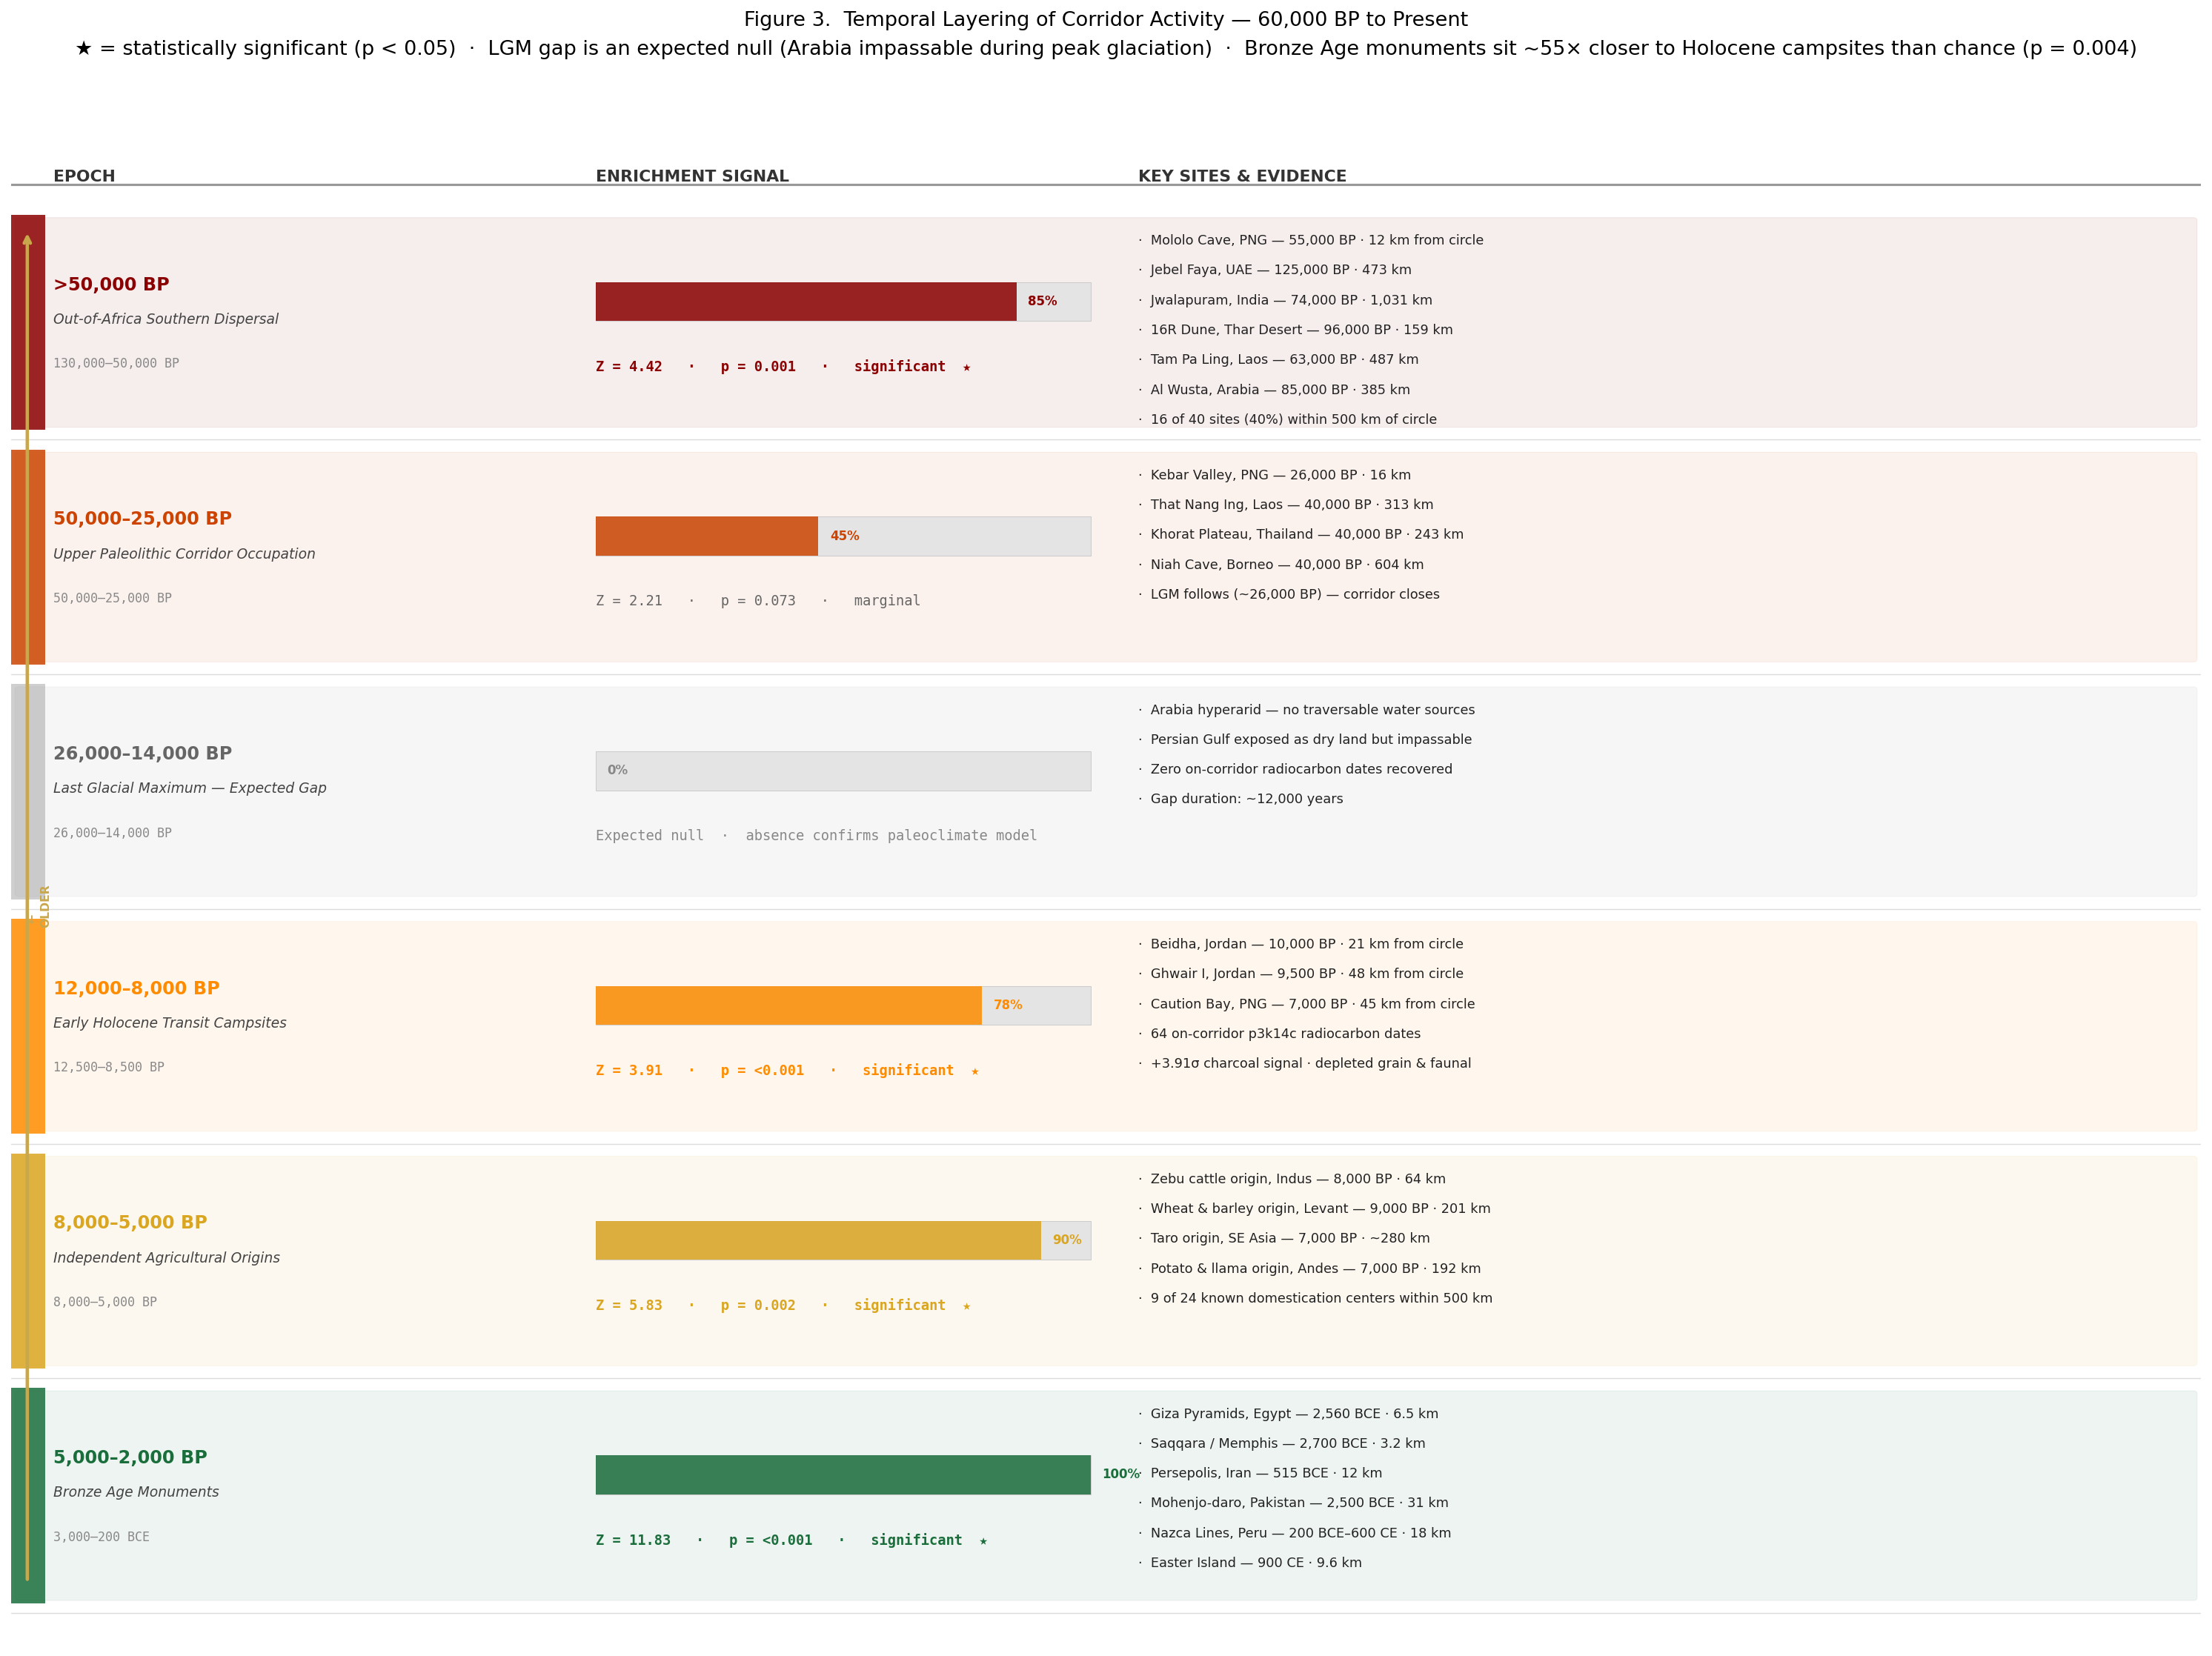
Age Dependence
Older sites cluster more strongly on the circle. This holds across both databases independently.
Megalithic Portal
Ratio: 2.51× stronger for prehistoric sites
Pleiades Gazetteer
Z at 25 km threshold. Independent replication.
Type Enrichment
Percentage of each site type that falls within 50 km of the circle:
Top Types by Circle Proximity
Settlement Baseline Test
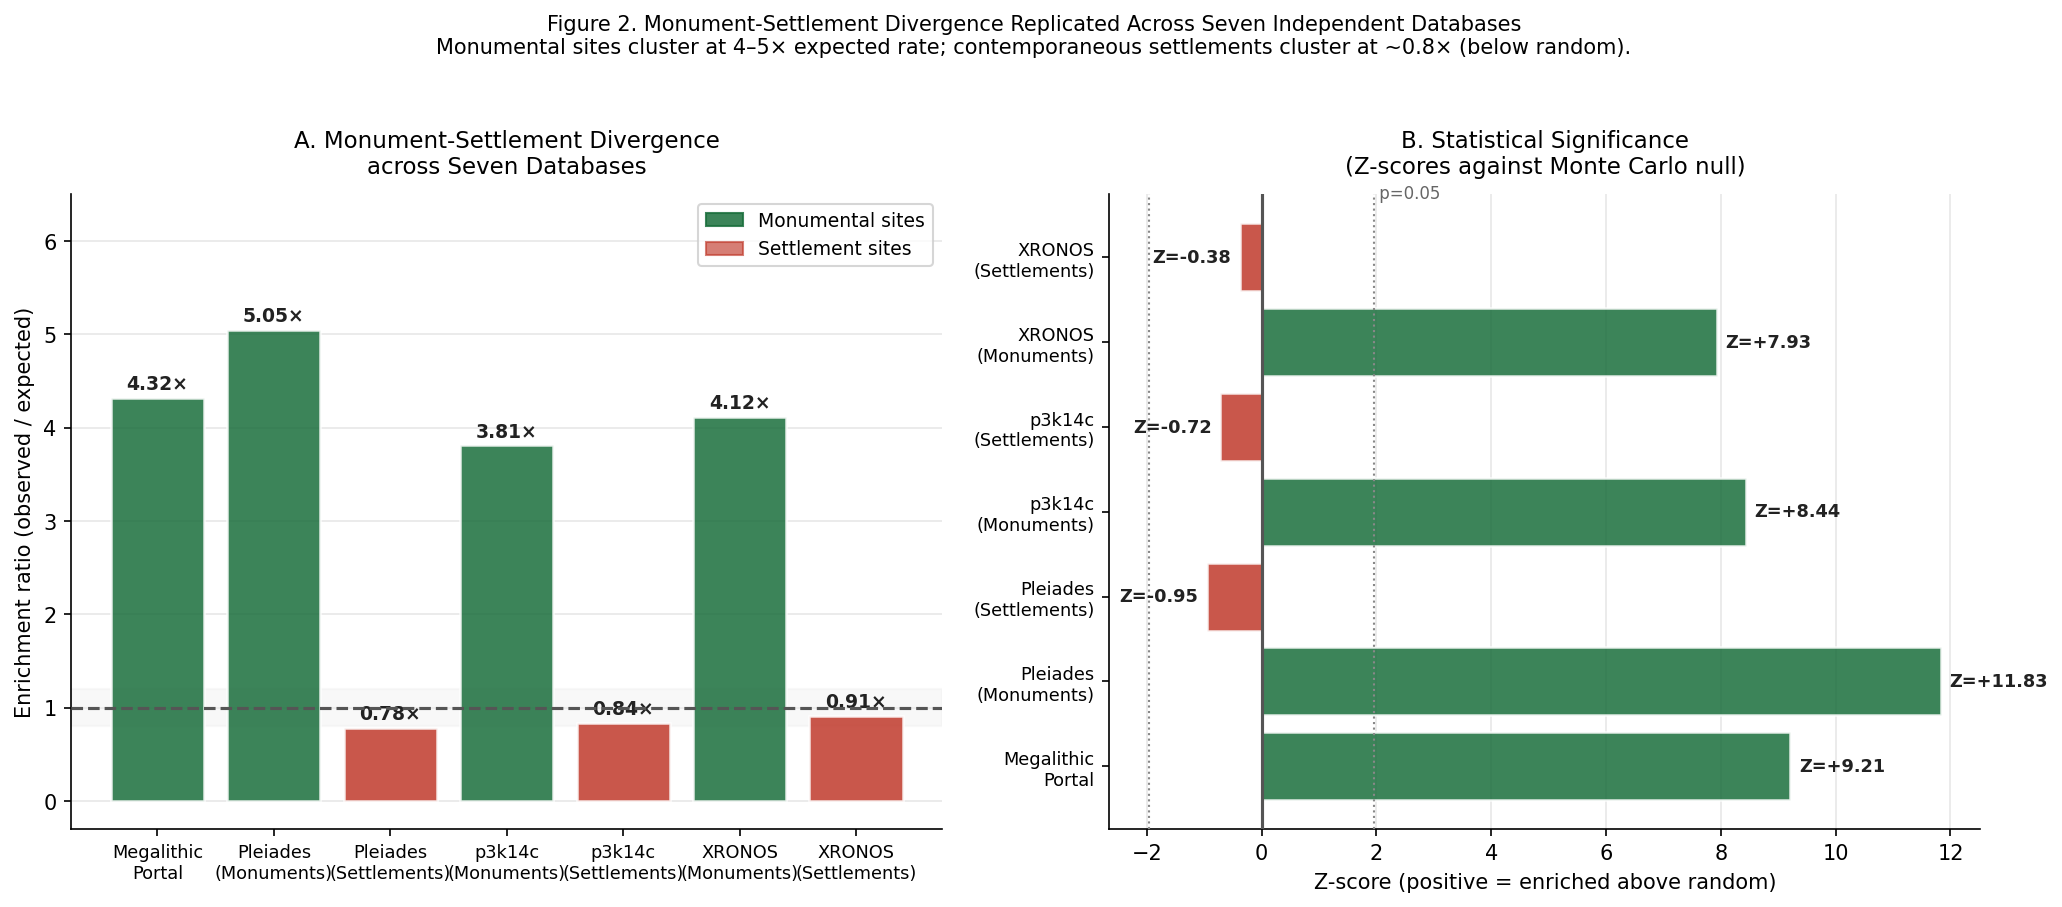
The critical geographic control — are all types enriched, or just monumental ones?
Monumental vs. Settlement Sites (Pleiades, ancient only)
Interpretation: If the circle simply traced fertile geography, settlements would cluster on it too. They don't. The signal is specific to monumental architecture — pyramids, temples, and geoglyphs — not to where people lived.
The Eight Clusters
| Cluster | Sites | Share | Oldest | Key sites |
|---|---|---|---|---|
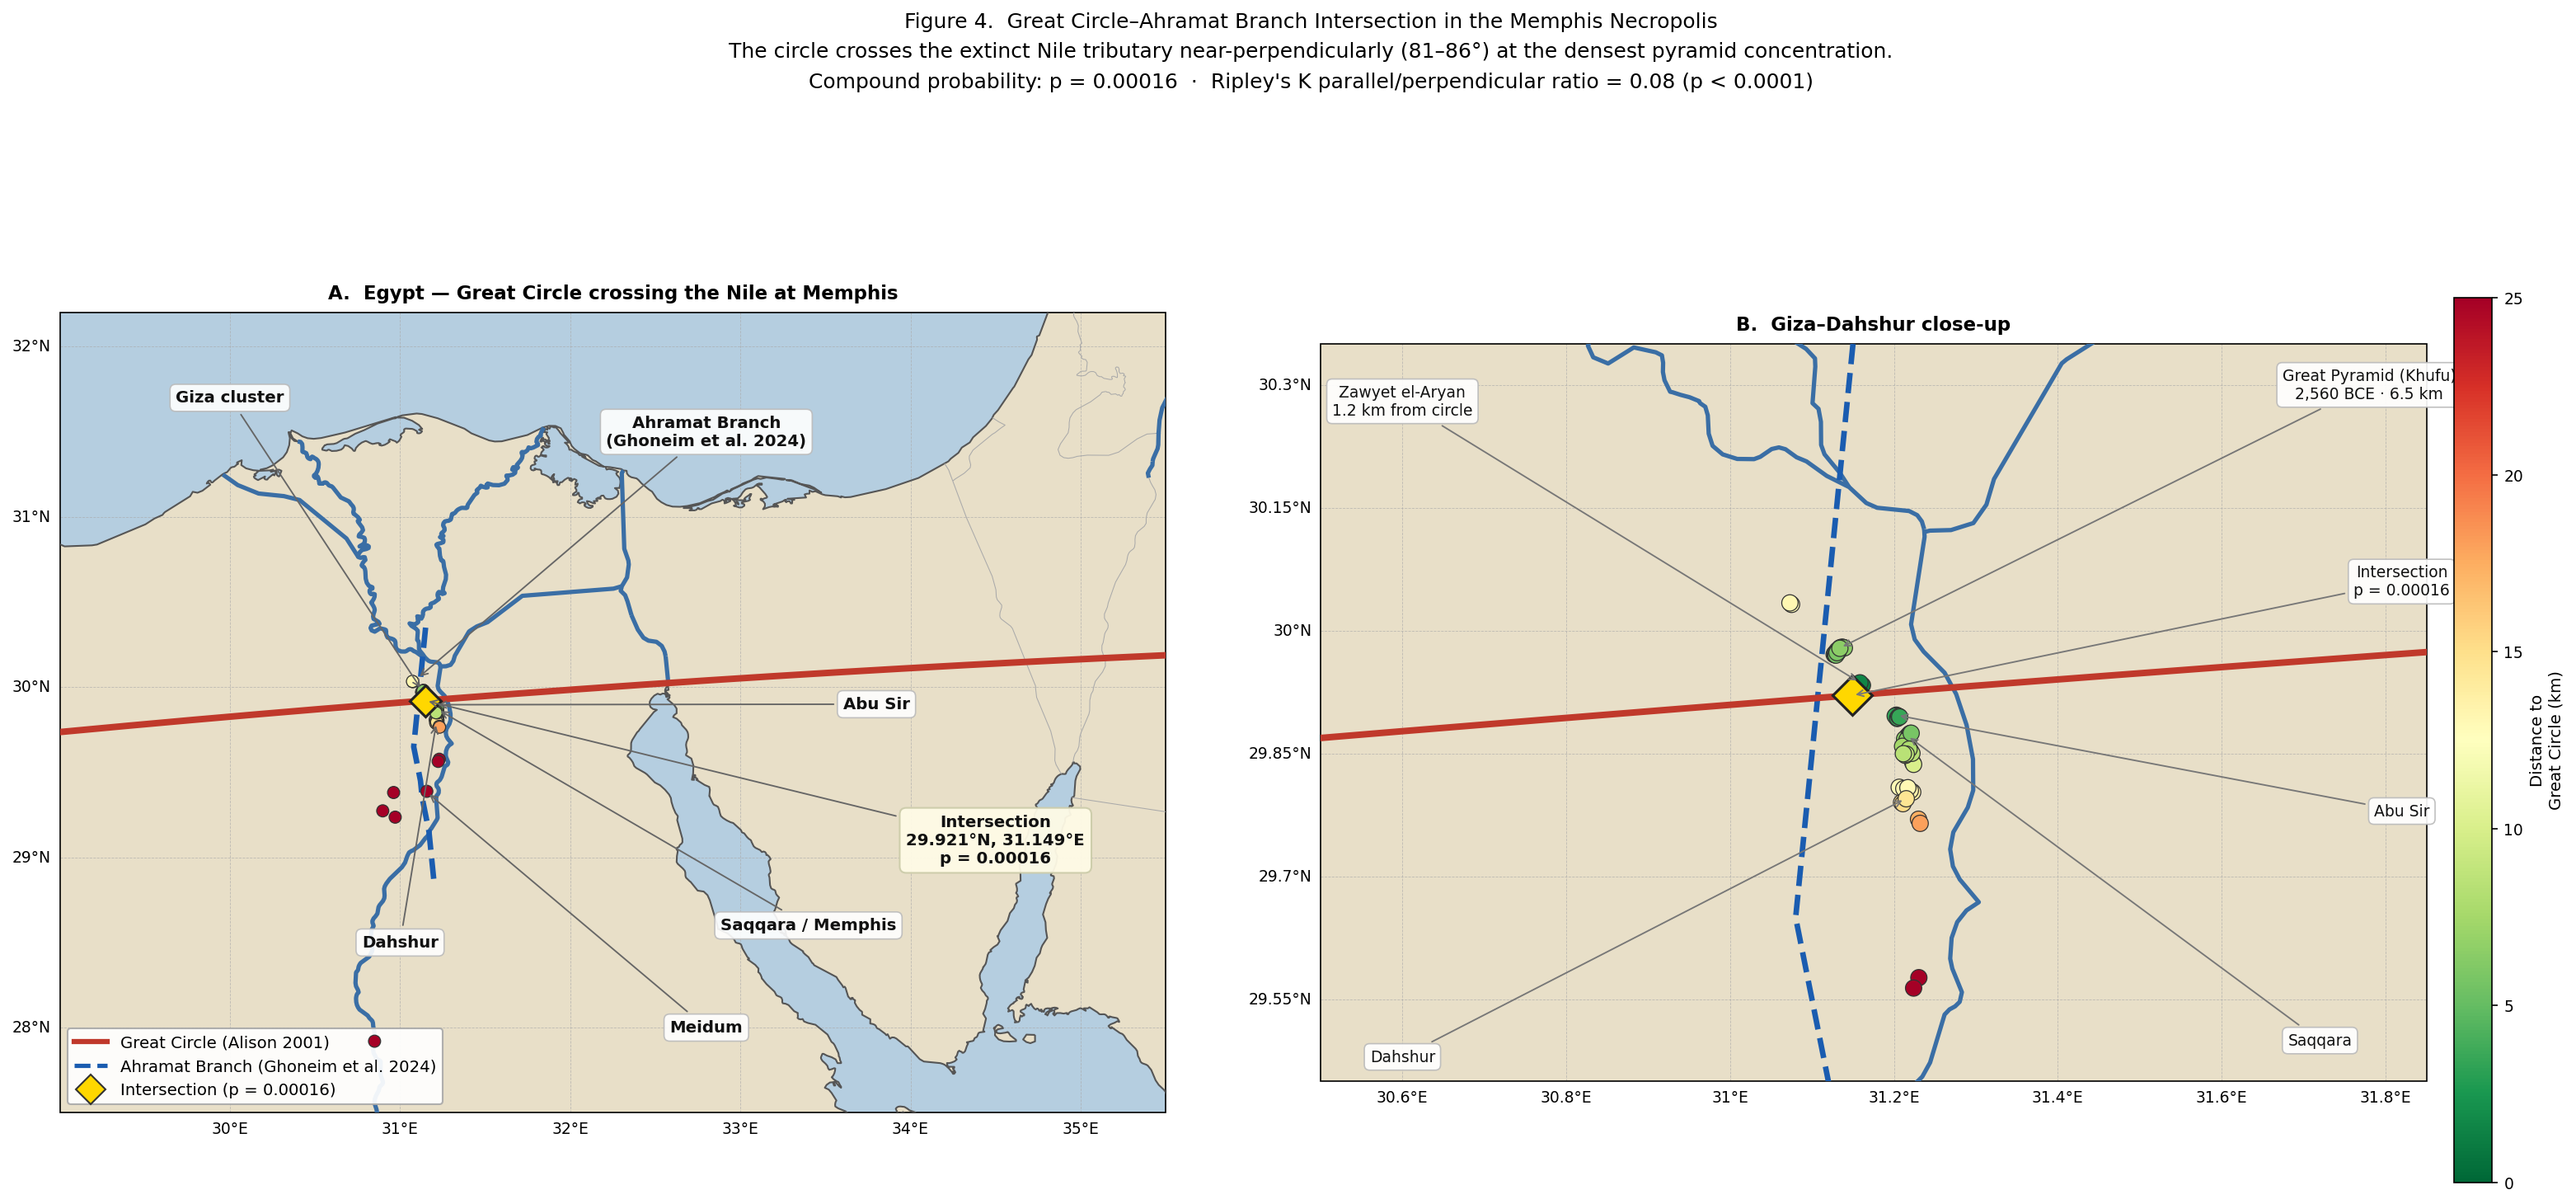
| Egypt / Levant | 315 | 8.6% | ~7000 BCE | Giza, Siwa, Petra, Nazareth, EES & BORDERSCAPE sites |
| Peru / Andes | 2,467 | 67.7% | ~3600 BCE | Nazca Lines, Palpa, Cusco, Ministry of Culture sites |
| Easter Island | 153 | 4.2% | ~700 CE | Moai platforms (ahu) |
| Amazon / Brazil | 62 | 1.7% | ~1000 CE | Tapajós sites, Acre geoglyphs, Marajó earthworks |
| Iran / Persia | 44 | 1.2% | ~5000 BCE | Persepolis, Pasargadae, Tall-e Bakun |
| Indus Valley | 164 | 4.5% | ~2500 BCE | Mohenjo-daro, Harappan sites in Sindh |
| Southeast Asia | 143 | 3.9% | ~1250 CE | Sukhothai, Preah Vihear, That Nang Ing |
| Other | 297 | 8.1% | Various | Kebar Valley, Caution Bay, North Africa |
Pre-Construction Evidence
Each cluster includes sites that predate known cultural contact between regions:
| Cluster | Oldest site | Date | Type |
|---|---|---|---|
| Egypt / Levant | Megalithic Portal sites | ~7000 BCE | Various prehistoric |
| Iran / Persia | Tall-e Bakun | ~5000 BCE | Settlement |
| Peru / Andes | Palpa Lines | ~500 BCE | Geoglyph |
| Indus Valley | Mohenjo-daro | ~2500 BCE | City |
| Easter Island | Moai ahu platforms | ~700 CE | Monuments |
| Amazon / Brazil | Acre Geoglyphs | ~1000 CE | Earthworks |
| Southeast Asia | Sukhothai | ~1250 CE | Temple |
Note: Four of the eight clusters (Egypt ~7000 BCE, Iran ~5000 BCE, Peru ~3600 BCE, Indus ~2500 BCE) contain sites older than 2000 BCE, predating any known long-distance maritime contact between the Old World and the Americas. Whatever produced this pattern, it was not a single historical event.
Summary
The pattern is statistically overwhelming, age-dependent, type-specific, and independently replicated across multiple independent databases. It is not explained by geographic coincidence. The mechanism remains unknown.
Paper 2 Findings
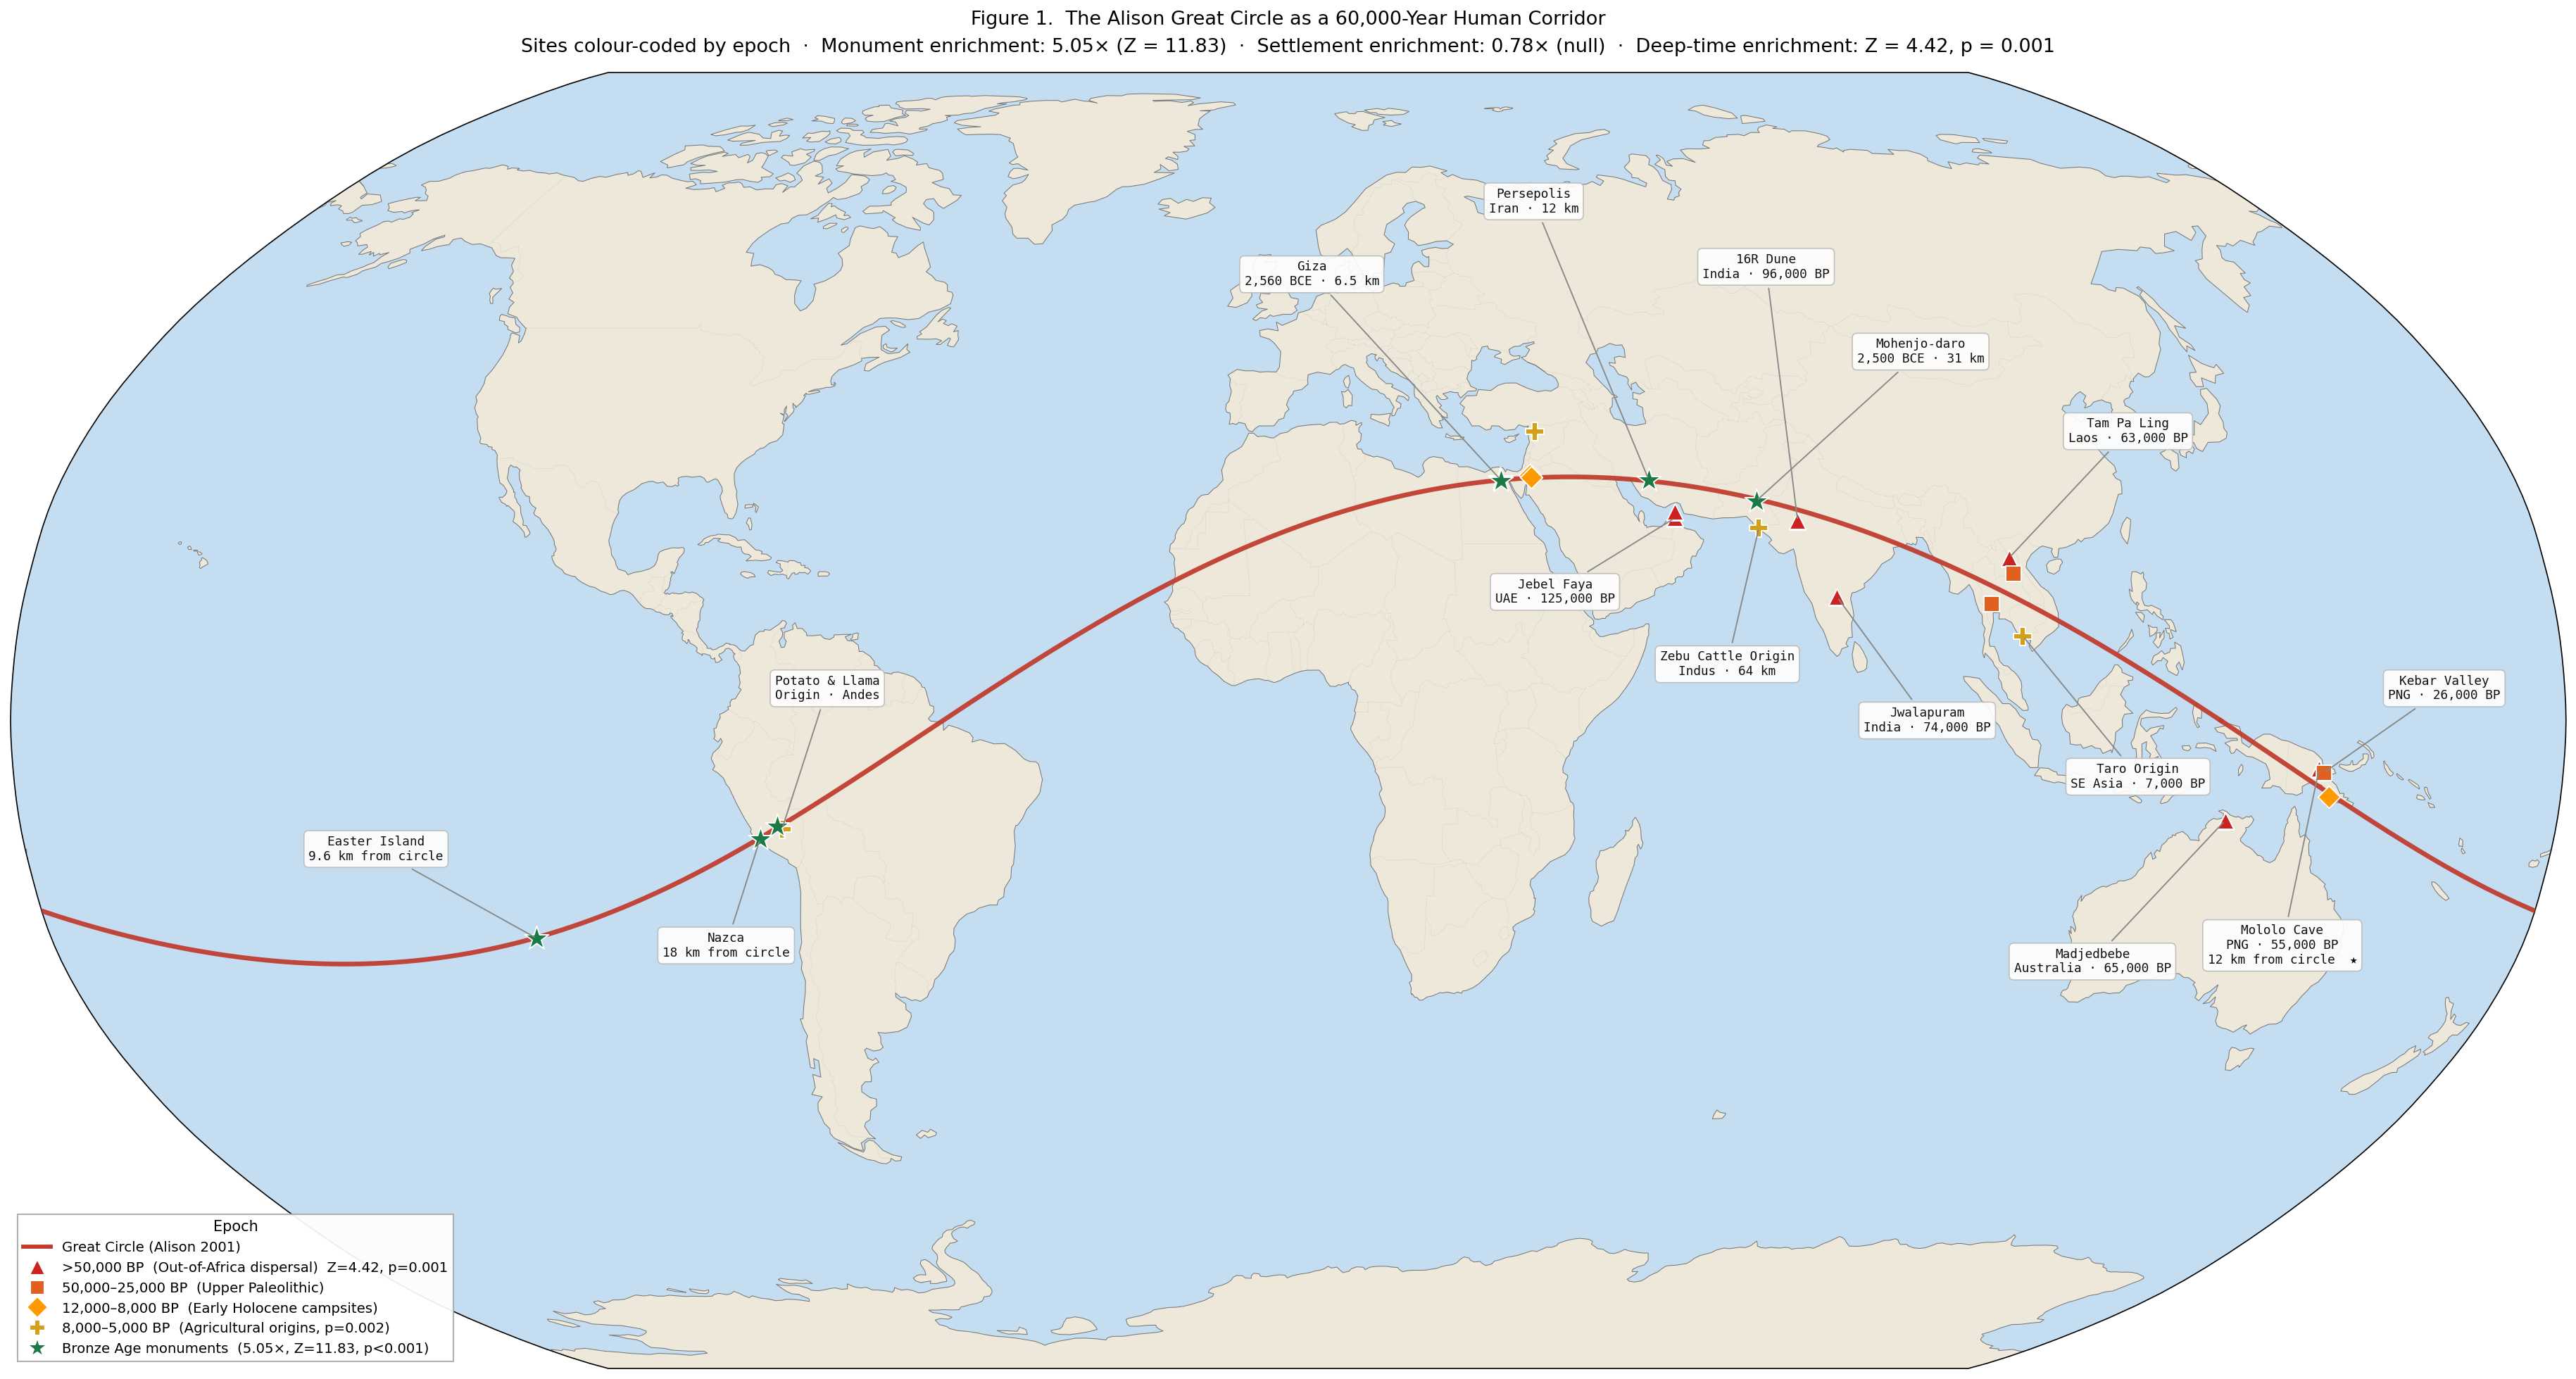
The following figures are from the companion study From Migration to Monumentality: The Alison Great Circle as a 60,000-Year Human Corridor (Allan 2026, submitted to Scientific Reports). All analyses use distribution-matched Monte Carlo simulation (10,000 iterations) against latitude-profile-matched random great circles. Preprint on Zenodo → | Explore the interactive migration map →